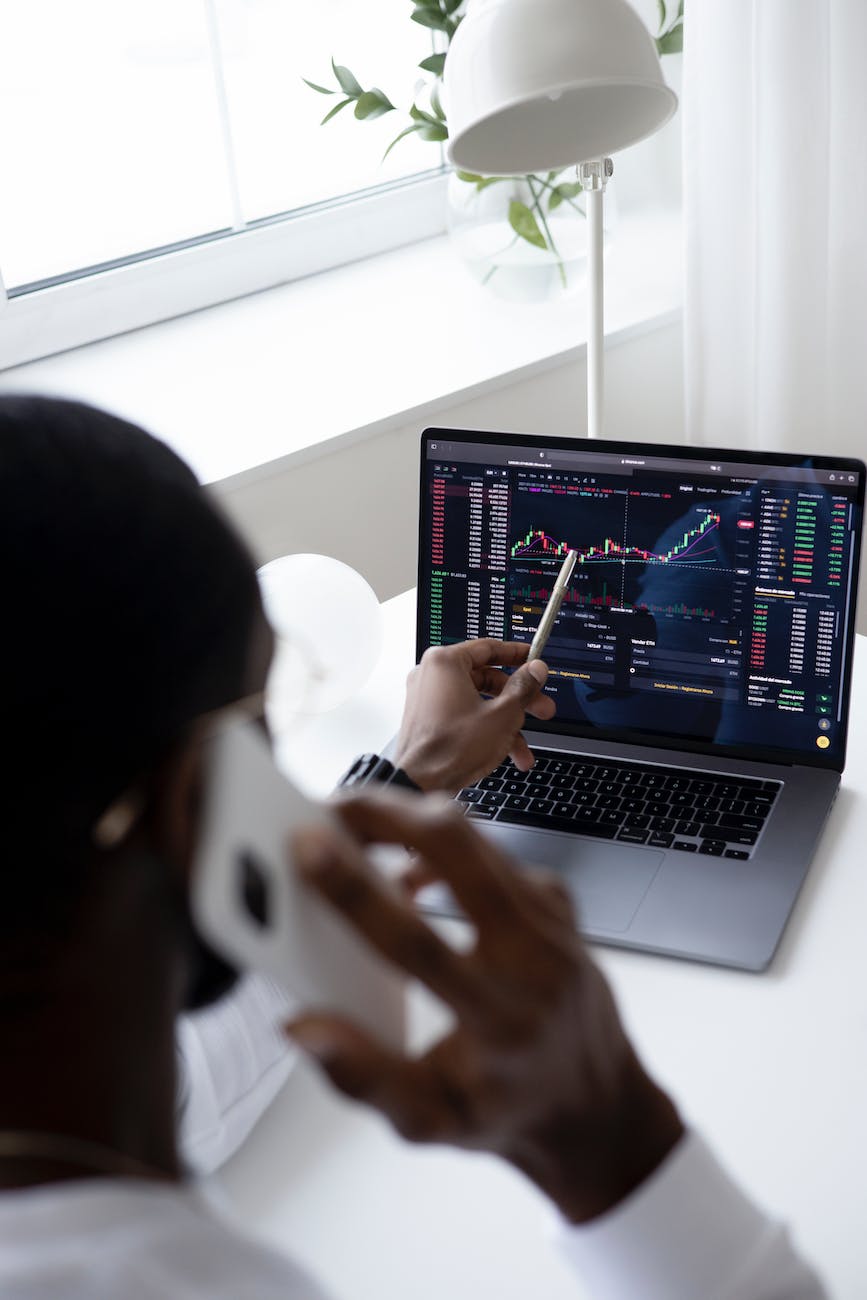
Among the trades that seem to bring substantial profits and see results the fastest. Trading crypto futures certainly seems to offer attractive returns. Some people trade on impulse. Pick and choose randomly. Just guess that the direction should go up or I think it should continue to go down like this, which is not wrong, but if you use your feelings like this, you probably won't be able to handle it. Using graphs to help make trading lively and bright, preventing mistakes that may occur
Futures is trading in which direction there will be an upward or downward trend. and trading in a fast-paced fashion You can leave it overnight or weekly, but don't forget to keep an eye on the liquidity or limit that will decrease over time. If the price moves closer to when? The portfolio may be cleaned or ordered to be sold immediately. As a result, the money in the portfolio may disappear completely in the blink of an eye!!
Trading like this Must rely on technical graph analysis to help. This will prevent damage or errors to a certain extent. Most of the commonly used indicators are RSI, MACD, Volume or others, depending on your expertise. If anyone doesn't have the basics of analyzing these things, they must be willing to study, research, and study before trading. This is a very good protection talisman
In addition, it requires skills, tactics, and experience in thinking, analyzing and making decisions thoroughly. Choosing to place and trade randomly It does not help make trading safe. But if it is too random
One such indicator, RSI, will help you trade with peace of mind. Popularly used is the RSI value. This indicator should be studied and understood more. Because it indicates the buying and selling pressure that exists in the market. Especially during which period? RSI has very high indicators. (Average approximately 30-70)
The closer the value is to 70, it means that there is a lot of purchasing power. Keep pushing the price up. When it reaches a certain level, there is too much buying power. There will be a sell-off. The graph will immediately start changing from green to boiling red bars. This opportunity will be the moment when many people may be worried when they hold the price and suddenly the price drops. But by the nature of trading When it can be red, it can be green. Strong selling force It might just be temporary or just a break. Moreover, this value may sometimes go as high as 70, so we cannot always evaluate it with just one RSI value. If you still need to use other indicators, including
On the other hand, the closer the value is to 30, it indicates that there is continuous selling pressure. This indicates that there may be a reversal to push the price up again. Because there is too much overselling. When the price goes down significantly will start to have buying power back in It is a reversal to make a profit again. Opportunity for good traders You should buy within this price range. Because you will have low costs and make some profit from trading
As mentioned above. Using just one indicator may not be enough. You have to look at the support, resistance, or price range that will run down and hit the edge of that price as well. Resistance price is like a price ceiling that the graph cannot break through when it hits. No matter how I run, I won't pass. This is called resistance because it's like a wall. Don't let it pass easily. The more times this value is encountered, the more It can be said that This resistance is important. Similarly, the support line will be like the floor of the room. Where will the graph be when it drops down? It will bounce back immediately, like we hit a ping pong ball, it bounces back, that is, the price seems to go down. But when did you find the support line? is ready to send the price back up as before Do not allow it to penetrate down to the lower floors at low prices. The more genres that encounter this kind of thing repeatedly and frequently. That indicates that it is an important support level as well. To make a profit, we should find an opportunity to buy at the price of these main important support levels
The next article will talk more about other necessary indicators. Which will not be just one. But it depends on the use of practice, looking at the assembly and seeing that it is useful. For safe trading
Thai Taste Journey: Cook & Culture Private Class
Immerse in an authentic VIP Thai culinary adventure in Bangkok. Explore morning fresh markets, master family recipes 100% hands-on, and connect through food. Intimate groups up to 4 guests.